Introduction
Upon selecting the Dashboard module from the navigation bar, the My Dashboard landing page will be displayed, as illustrated in the image below.
The dashboard consists of several tabs, including My Dashboard, Main, Leads, Opportunities, and Quotations.
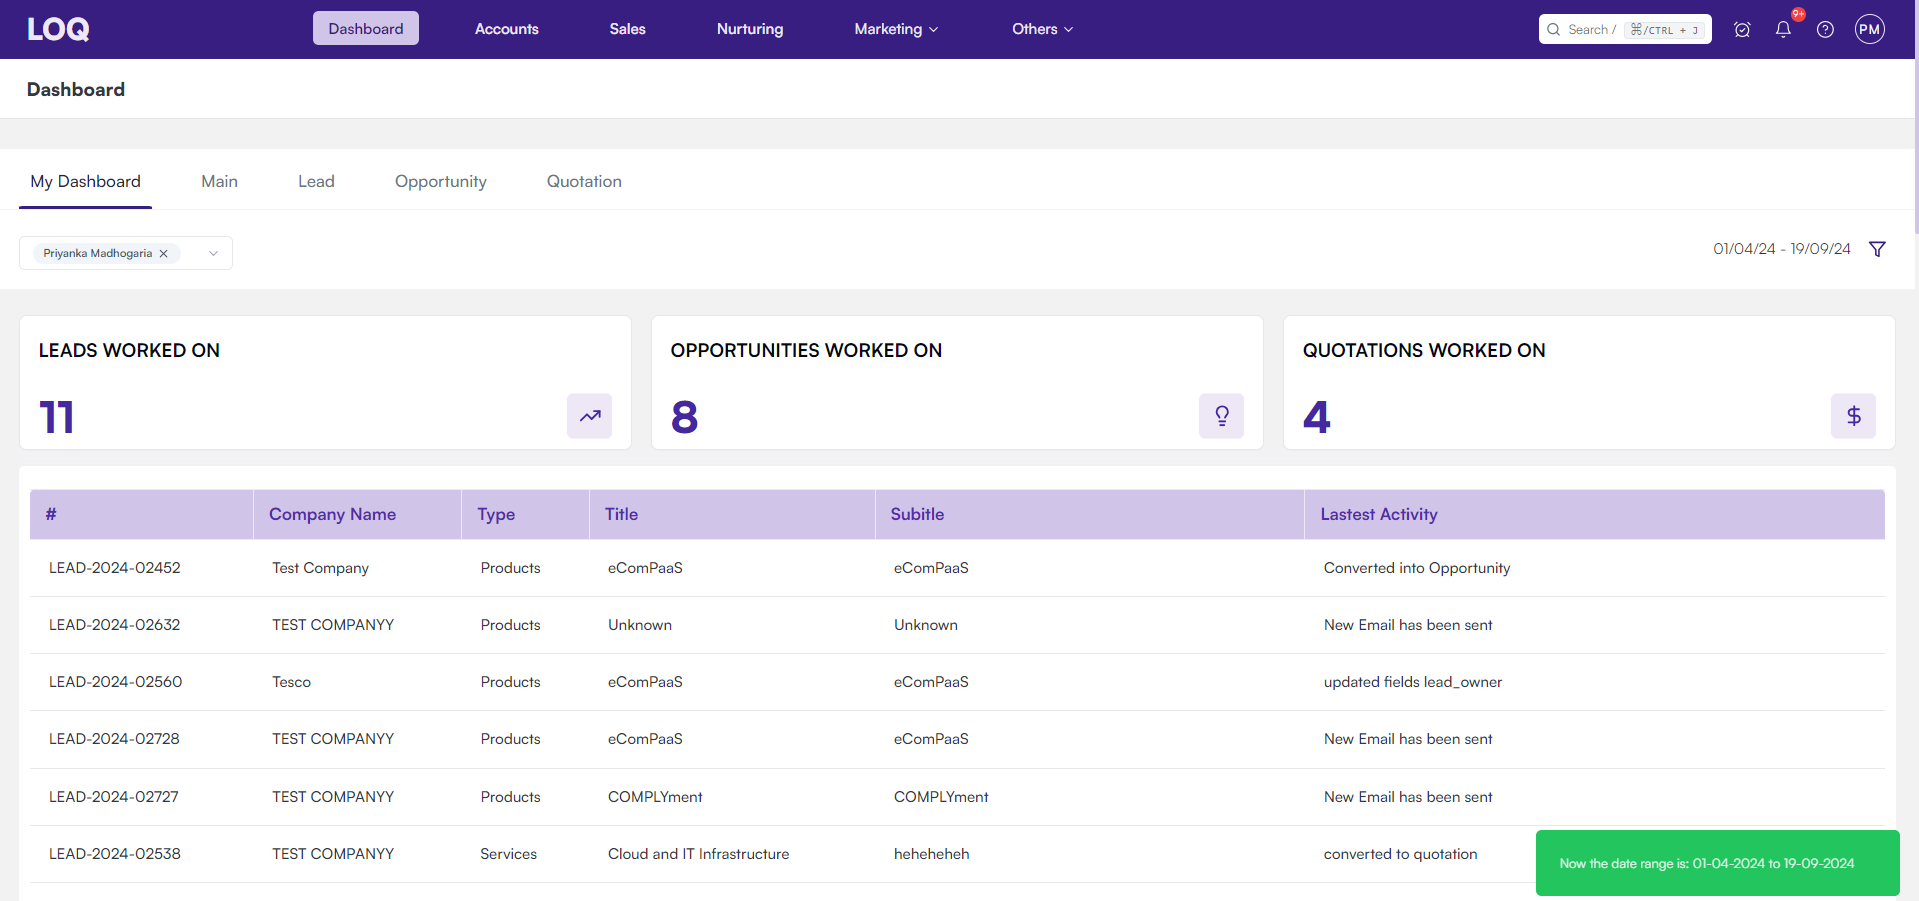
In all tabs of the dashboard, the Admin user has the capability to filter data by both users and date. Non-admin users, however, can filter the dashboard data by date only. The data displayed will dynamically adjust according to the selected filters, reflecting the chosen time period or user. This functionality allows users to concentrate on specific data sets, providing a clearer focus on relevant information for the desired time frame.
My Dashboard
The My Dashboard section provides an at-a-glance view of key performance indicators (KPIs) that highlight your core activities and areas requiring attention. Below are the KPIs explained in detail:
-
Number of Leads, Opportunities, and Quotations Worked On
- This KPI displays the total number of Leads, Opportunities, and Quotations that you have worked on during a selected time period.
- By clicking on this card, you can view detailed information about each lead, such as the company name, the offerings pitched, and the activities performed within that lead, opportunity, or quotation.
- This feature allows you to review your interactions and actions taken for each lead, helping you track the progress of your sales activities efficiently.
-
Number of Leads, Opportunities, and Quotations Converted
- This KPI tracks the number of Leads, Opportunities, and Quotations that have advanced to the next stage of the sales pipeline during the selected time period.
- Clicking on the card allows you to see detailed information about the converted leads, opportunities, and quotations.
- From here, you can further drill down by selecting a specific lead, opportunity, or quotation to view a summary of its details, providing insight into your conversion success.
- This helps users keep track of all conversions, enabling a deeper understanding of what’s working within the sales process.
-
Expected Closing Date Pipeline
- This KPI shows the number of Leads, Opportunities, and Quotations expected to close within a selected period of time.
- By focusing on the leads expected to close soon, this feature helps users prioritize their efforts and close deals more efficiently.
-
Next Contact Date Pipeline
- This KPI tracks the number of Leads, Opportunities, and Quotations that require a follow-up or next contact within the selected time period.
- This helps users stay organized by knowing exactly how many leads need attention, ensuring that follow-ups are not missed and relationships are maintained.
Main Dashboard
The main dashboard shows number such as total ongoing leads, opportunities and quotations, total deals won, and total deals lost. And all the conversions rate throughout the sales pipeline.
Data for sales pipeline: all the leads present in the sales pipeline and in what stage
Project Acquisition: time taken to aquire the project from the lead stage
Activity Metrics: Email activities done by the users are displayes
Leads Tab
Leads are individuals or entities (such as businesses) that have expressed interest in a company's offerings but have not yet made a purchase or commitment. In this tab, graphs represents Aging by Users, Aging by Status, Trend of lead, Type Segregation, Source Segregation based on the date and user selected.
Opportunities Tab
Opportunities refer to potential sales or business deals that have progressed beyond the initial lead stage and are actively being pursued by sales representatives. They typically represent qualified prospects who have expressed interest in purchasing a company's products or services. In this tab, graphs represents Aging by Users, Aging by Status, Trend of lead, Type Segregation, Source Segregation based on the date and user selected.
Quotations Tab
Quotations are formal documents prepared by a company and sent to a potential customer in response to a request for pricing or as part of a sales proposal. They outline the costs, terms, and specifications of products or services offered by the company. In this tab, graphs represents Aging by Users, Aging by Status, Trend of lead, Type Segregation, Source Segregation based on the date and user selected.